Our work is changing fast. Our technology investments are relatively easier to measure now. Tools in data lakes or in customer interaction insights help the product leaders measure their work more closely now, they can plan for growth for the right metrics. It also means that more products are being designed for a variety of integrations and external technology dependencies because they can see the direct measurable benefits, and validate their use case.
In recent years, the design systems have played an important role in the designers-engineers collaboration. The discussions on the ROI of design systems are part of many design conferences, communities, and writings, such as by Cristiano Rastelli, by Ryan Lum, or in this Knapsack report.
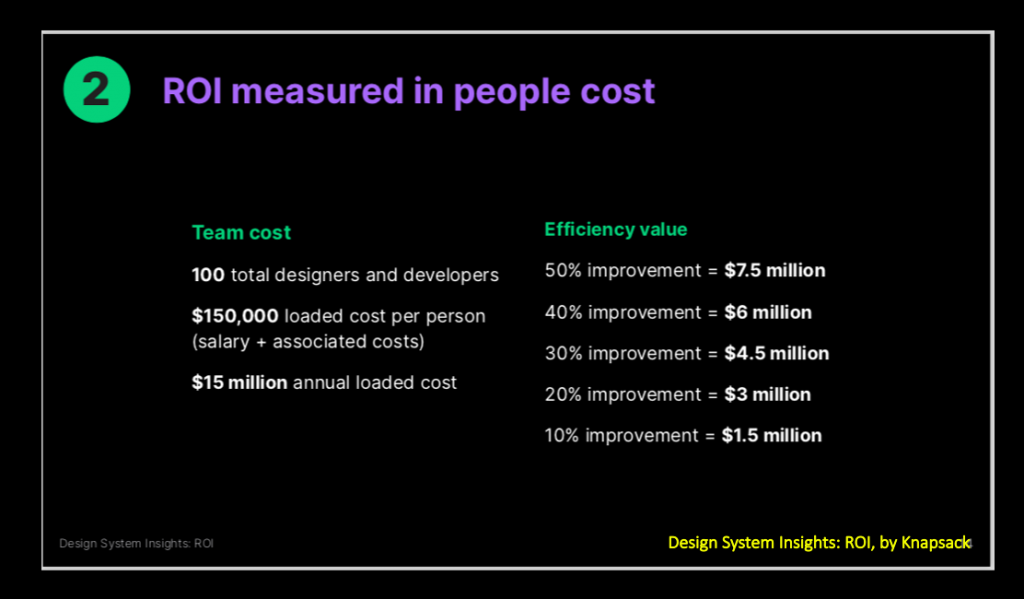
The value of design systems is discussed mostly in terms of the increased and faster collaboration between different teams for a shared reference to the digital assets, operational efficiency, speed in the product operations, and for the consistency in product and brand positioning. If you see the examples in Cristiano’s post or in the Knapsack report, the direct and measurable benefits of a design system are a huge plus for an organization.

Design systems are around us for a few years now, which means that we are beginning to see talks on the future of design systems.
For example, it is for the advanced level operational use of design systems using functions in the design systems, or to find the ways to use a design system as a strategic growth lever by adding system thinking based interconnectedness in a design system.
Note: When I use the term ‘design system’ in this post, it includes content system as well for the context in this post. This is because most of the design systems that I have seen contain content guidelines and standards are part of the design system itself. There are exceptions of course such as Intuit content design system and for such cases, you can assume that I use the term ‘design system’ interchangeably.
For the product metrics
Imagine any design system that you have seen anywhere—it has all the veins and the muscles that make our products. The tokens and the components, the brand guidelines, the messages, the design principles that guide us in the same direction for design, engineering, and content. Now think how we are measuring their value—by the number of hours saved? That is such a waste. A limited perspective design or product leadership in 2022.
Look at the speed of technology development in marketing, code, deployment, data sense, and we are still designing the design systems as our inventory-like digital assets of 2016-2018.
Different teams use some metrics to evaluate their performance or role in the product’s success. For example UX metrics can be task success rate, error rate, adoption rate, task based efficiency, usability score, and others. Engineering metrics such as build time, code volume, code churn or code shelved, reliability score, incident rate (DevOps), throughput are somehow mapped to the product metrics, either as a function of time, or as human-hours, or human-efficiency. Likewise for content metrics, research metrics, and DesignOps metrics (example).
Examples: UX and customer retention
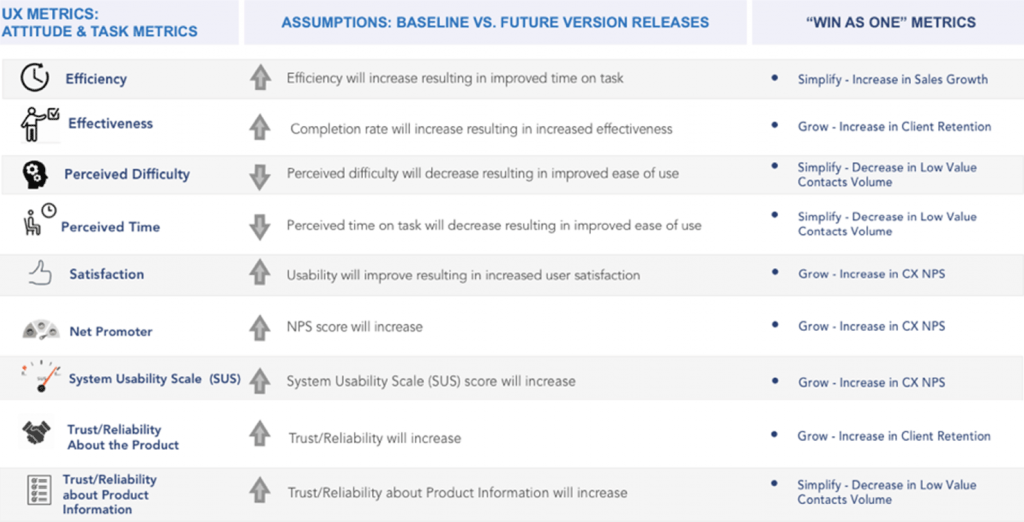
In this UXmatters post, see how different types of UX metrics are directly impact the product metrics, such as the retention and growth.

Myk Pono shares the UX metrics as a customer journey flow and it helps us relate the design’s role directly to the product metrics.

Since design systems are closer to the design teams as compared to the engineering or other teams, it is easier to plan baking the design systems metrics into the design metrics.
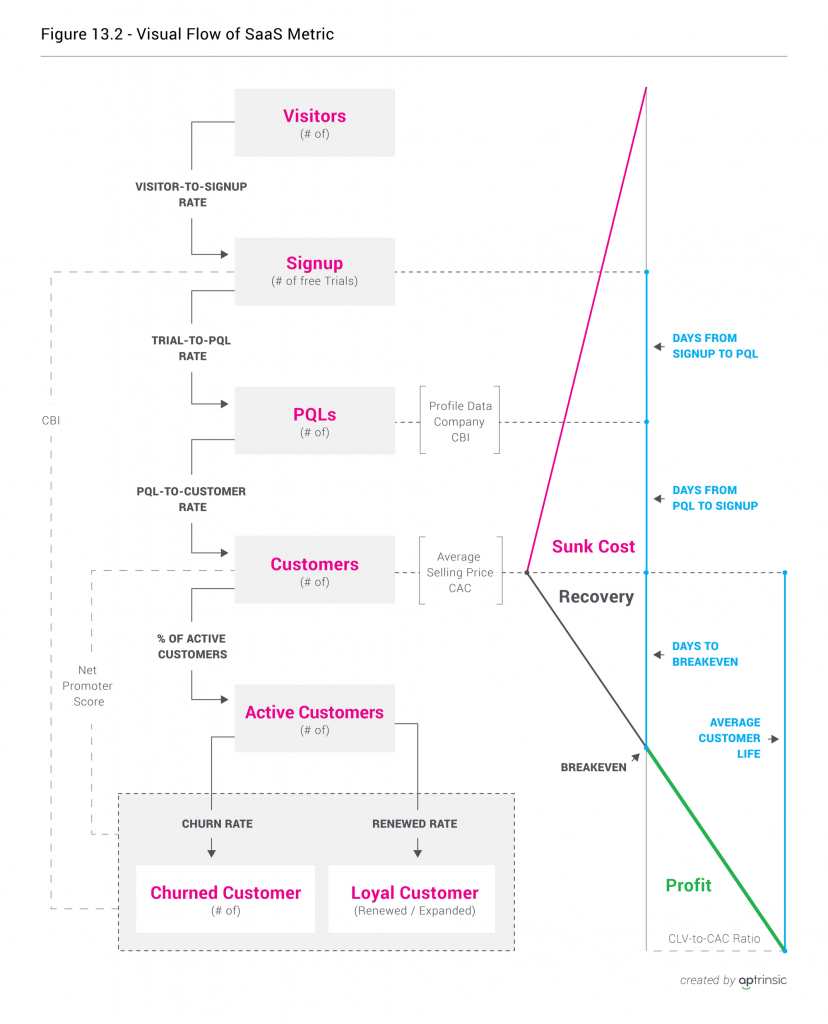
Take an example of a SaaS where a few common and important metrics are the CAC (Cost to Acquire Customers), LTV (Lifetime Value), MRR (Monthly Recurring Revenue), churn rate, burn rate, ARPU, and others. Let’s discuss at least one metric in detail to understand its role in design and engineering.
Customer Acquisition Cost (CAC for short) is the cost for a business to acquire a new customer. The metric is used in many industries but it’s very important in SaaS because the entire business model revolves around the lifetime value of the customer (LTV) (source: Price Intelligently).
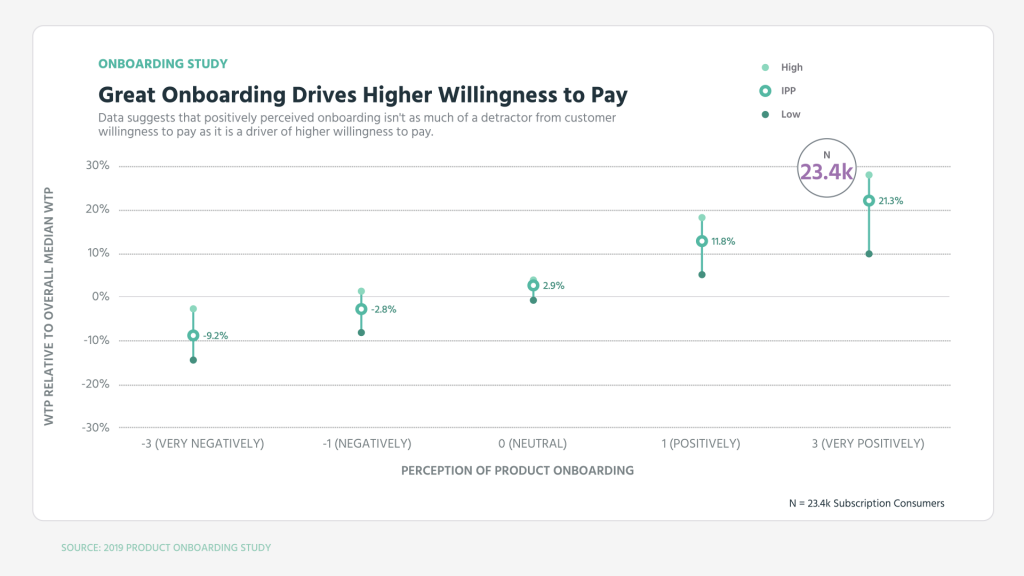
The engineers and the designers see the role of onboarding in product success, differently. Profit Well conducted a study for just under 500 different software products spread between B2B and B2C and nearly twenty five thousand customers of those products—strategically designed onboarding drives higher customer retention and it helps in the customers’ willingness to pay (source).

For the designers and engineers and content practitioners working in the product team, it is not a rocket science to directly relate our work to these metrics. Onboarding is not about design or content or code. It is a thoughtful and strategic intersection of different skills and roles, including product marketing, UX content, and a lot of product sense. If customers drop off at a certain stage, or if the product is not inspiring enough for the customers to start paying (or continue paying if they are already paying), it directly shows in the product metrics and the individual metrics of different teams.
It could be because of the gaps in usability, or code error, or a poorly designed customer journey itself, or inaccurate messages, or unclear interactions, or a combination of such factors.
Remember that all these teams used the design system. And remember that the design system might still show the ROI as hours saved, and efficiency, and the increased speed in build and shipping.
This is why we need to map the design systems metrics with the product metrics.
UX brings the right awareness in the team for how to design for customer engagement, for the value they seek in the product, for their goals, their stickiness, and for a customer-centric experience that drives business goals too. A design-mature organization might already have a process to map the UX and content metrics to the product metrics, as I shared an example of Myk Pono’s diagram earlier in this post.
So we have functional metrics somewhere aligned with the product metrics.
- (A) product metrics, directly linked to customers’ willingness to continue using the product and their willingness to pay at any stage of their journey
- (B) functional metrics for onboarding, retention, churn, growth—how onboarding supports the customers, what are the retention points and where churn happens (revenue team have these numbers)
- (C) design system metrics (operations, collaboration, velocity) for their role in functional metrics. For example these can be directly mapped to the onboarding, for the account activation time, account activity length, cost of delay.
I assume that many teams already mapp (A) to (B). We need to map (B) and (C) for more structure and value in how we measure our digital work investments. Once we do that, we can establish the pipeline for the intersection of metrics in (A), (B), and (C).
While the design-driven organizations such as Airbnb use design roadmaps and not product roadmaps, it clearly shows that we need to be more strategic and visionary in planning the design systems. While adoption is an important design systems metric, we need to plan it for beyond adoption. This is what makes us truly learning organizations.
I hope that strong engineering-driven teams such as Stripe or highly data-driven teams such as Netflix are well-positioned to design their design systems around the core measurable product metrics.
Thank you to Michael Haggerty-Villa of Compass (see their LinkedIn) for reviewing this post.
Related posts
- Adding the system in a design system
- A systems driven content supply chain is the lifeblood of customer experience
I am speaking on this topic at the OmnichannelX conference in June 2022. Join me there.
—
This topic is part of my advanced course in product content strategy, content design, and UX Writing. See the course details for how we can find and add more meaning to our work.
